
Somewhere in your reporting there are two numbers that used to move together.
One is how often you appeared in search. The other is how often anyone came. For most of the time you have been measuring them, the first predicted the second well enough that nobody had to think about it. Appear more, get more visits, get more enquiries. The chain felt like arithmetic.
Check the last four quarters. If those two lines have started to drift apart, you have probably already explained it to yourself. A ranking slipped. A competitor got aggressive. The content needs refreshing.
There is a simpler explanation, and it has nothing to do with your website.
It is happening to everyone.
SparkToro studied Similarweb's desktop and mobile panel for January to April 2026. Sixty-eight per cent of Google searches in the United States ended without a click to anyone. Not to you, not to a competitor, not anywhere at all.
In the United Kingdom it was 69.5%, the highest of any country measured. Germany came out lowest at 62.1%, and even there, no country still sends 300 clicks to the open web per thousand searches.
The trend has a shape worth looking at. It was 45% in 2016. It was 49% in 2019. It passed 60% in 2024. It is 68% now.
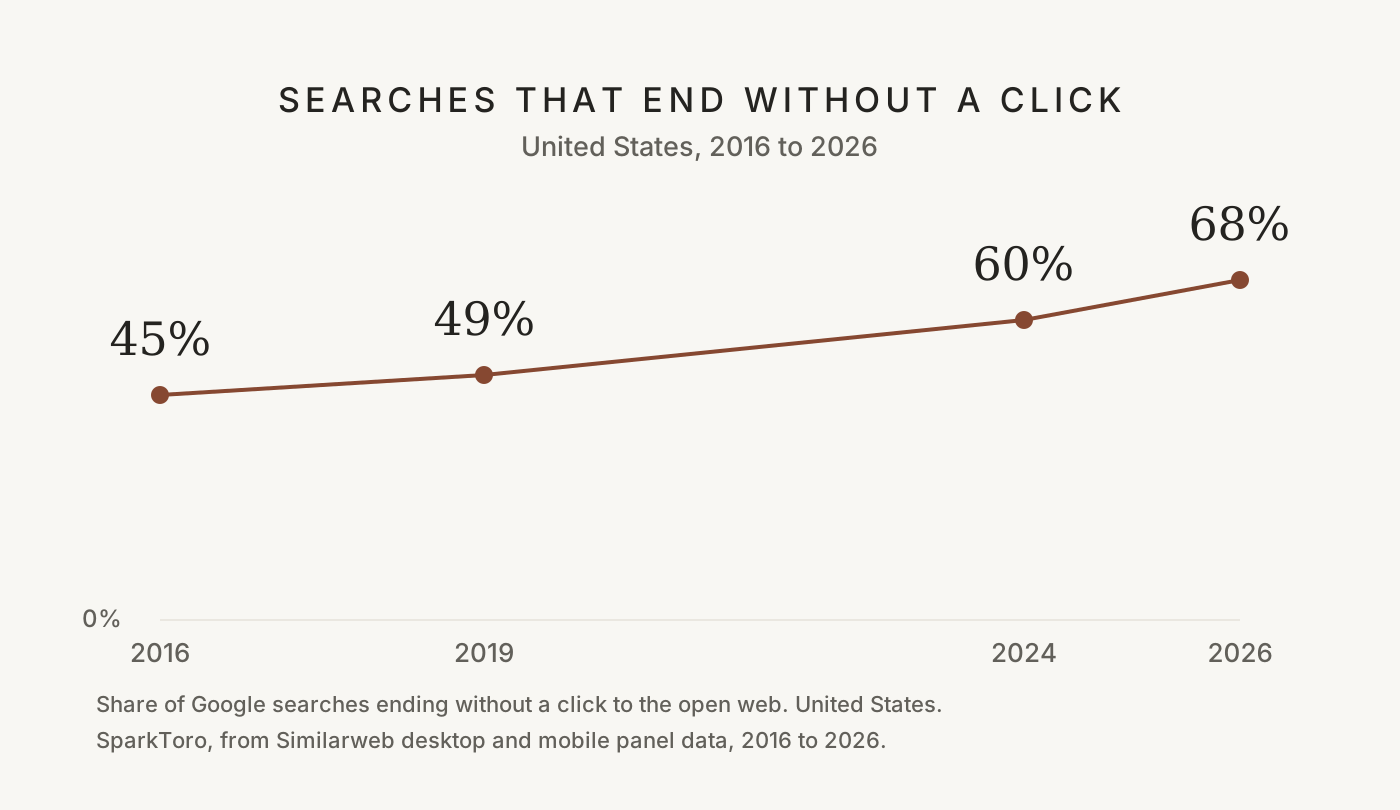
So the drift in your report is not a mystery, and it may not be a failure. Being found and being visited have come apart, everywhere, and it is measurable.
Nobody decided this. Three things caused it, and only one of them gets discussed.
Why the two came apart.
The first is the answer panel. Google's AI Overviews appear on roughly 18.9% of United States keywords, by Ahrefs' count. Ahrefs' own study found AI summaries can cut clicks by 34.5%. When a panel cites four sources to answer one question, four sites record an impression. The reader gets what they came for and closes the tab. Four businesses were found. None was visited.
The second is the results page itself, which now answers things outright. Opening hours. Definitions. Conversions. A phone number. Queries that used to produce a visit now produce a reading, and the business is none the wiser.
The third is quieter, and it matters more for a business like yours. Your buyers do a great deal of their research somewhere you cannot see. A private community. A message from a colleague. A podcast. A conversation at a conference. They arrive already knowing who you are, and the visit that finally shows up in your analytics looks like a direct one, attributed to nothing.
Notice what those three have in common. In every case the business was found, and in every case the finding did not produce a visit. The relationship did not weaken evenly. It broke in specific, explainable places.
None of this means search stopped working. It means the number that used to stand in for search working has stopped standing in for it.
At which point a reasonable person asks what any of that has to do with their business.
What that 68% does not say.
Fair question, and the honest answer takes a moment, because a number that large gets misused constantly.
It does not mean 68% of your buyers vanished. It counts searches, not people. Someone researching one purchase might run nine searches and click on the tenth. All nine count as clickless. The purchase still happened.
It does not mean those clicks went to a competitor. They went nowhere. Most of those queries ended on the results page.
And it does not describe your market. That figure covers every Google search in a country, most of them everyday ones: conversions, definitions, opening hours, football scores. Commercial searches are a small and very different slice, and no public study isolates them. Anyone quoting you the 68% as though it were your sector's click rate is overreaching, and so would I be.
One more caution, because it affects every benchmark anyone shows you. The same study measured six countries and got six answers. The United Kingdom at 69.5%, the United States at 68.0%, France at 65.3%, Canada at 63.8%, Italy at 63.4%, Germany at 62.1%. Measured as clicks reaching the open web per thousand searches, Germany sends 287 and the United Kingdom 232. A quarter fewer, same year, same panel. If a seven-point spread exists between countries, the spread between industries is unlikely to be smaller. Your own history is the only comparison that holds.
What it does establish is direction and size. The gap between appearing and being visited is real, it is wide, and it has grown every year anyone has measured it. That is enough to make one distinction worth drawing. It is not enough to tell you what your own numbers mean.
Which raises the more useful question. If those two numbers no longer predict each other, what is each one actually telling you?
Three questions, not one.
Here is the distinction. It looks obvious written down, and almost no reporting behaves as though it were true.
Were you found? An impression answers this and nothing else. Your page was eligible for a query and it appeared. That matters. It is the only number that tells you whether you are in the running at all, and if it sits near zero for the phrases your buyer uses, nothing downstream can rescue you. What it does not tell you is whether a human being read it, or went anywhere afterwards.
Were you visited? A session answers this. Someone saw their options and chose yours. That is a real and underrated signal about your title, your description, and the fit between your page and the question asked. What it does not tell you is a single thing about the person. Not their budget, not their role, not whether they have the problem you solve.
Were you suitable? Only an enquiry, read by a person, answers this. It tells you someone had a problem you can solve and some means to act on it. That is the only point in the whole chain where a human makes a judgement about fit.
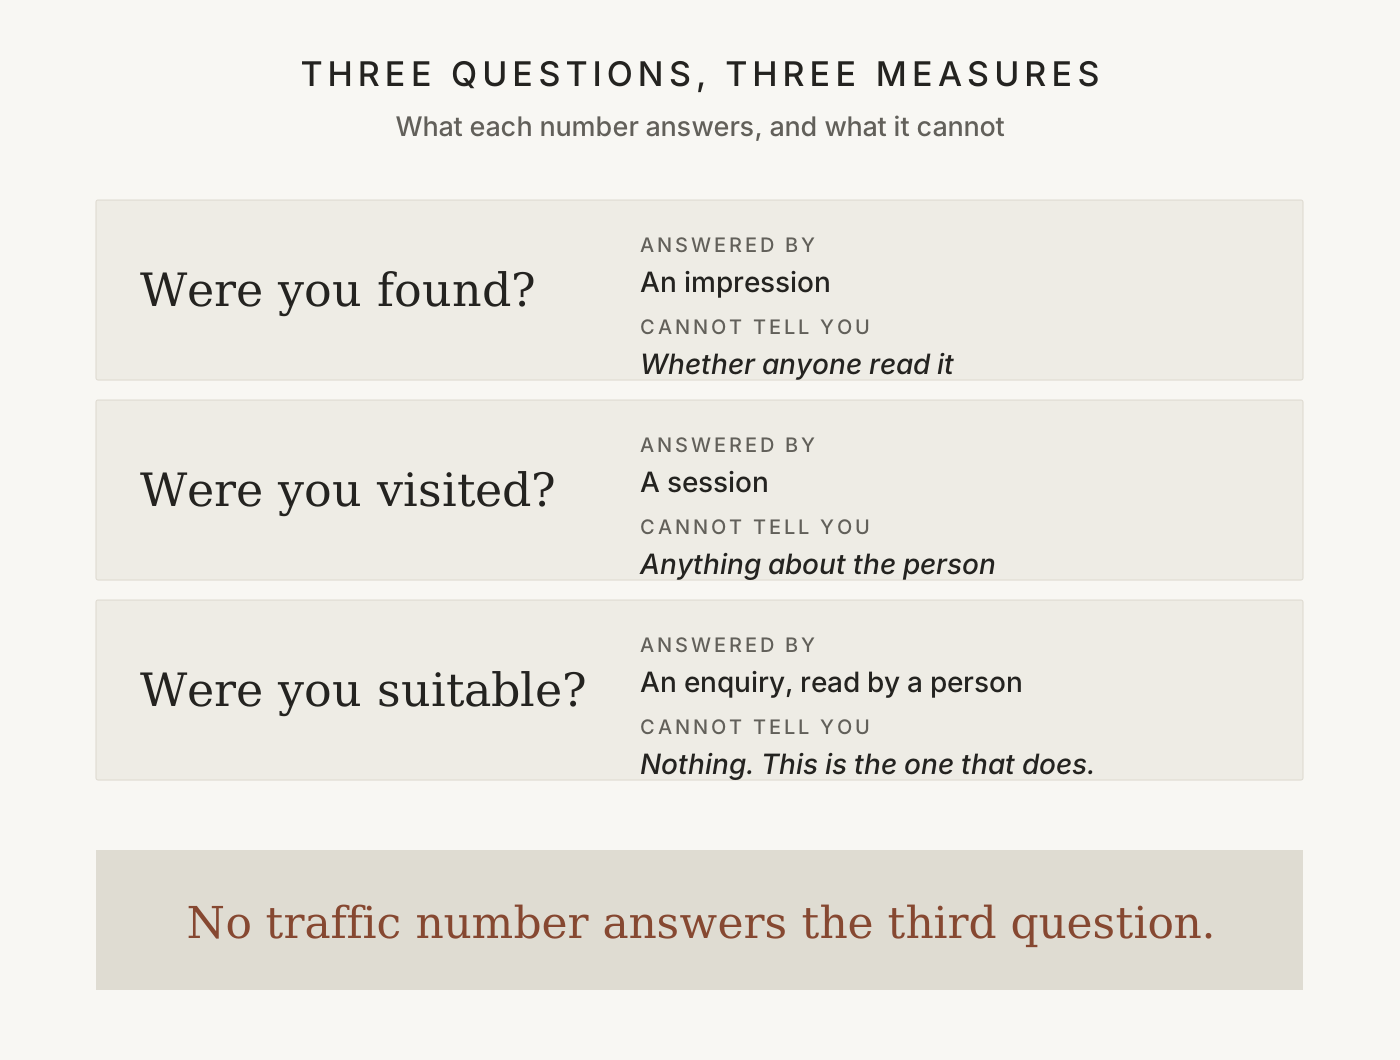
No traffic number contains that information. Not one. You cannot derive it, model it, or scale your way to it. A thousand sessions hold exactly as much information about suitability as ten hold: none.
That sounds abstract until you put two companies side by side.
Two businesses, one set of numbers.
Forty thousand impressions. Two thousand sessions. Twenty form submissions. Both companies, same quarter. Both invented to make the point, not taken from anyone's account.
The first sells payroll software to companies with more than two hundred staff. Their traffic comes from a guide to payroll legislation that ranks beautifully and is read mostly by students and nine-person businesses. Twenty forms arrive. Eighteen are from companies they cannot serve. Two are worth a conversation.
The second sells the same software. Their traffic comes from people comparing them against a named competitor. Twenty forms arrive. Fourteen are from companies actively switching. Most are worth a conversation.
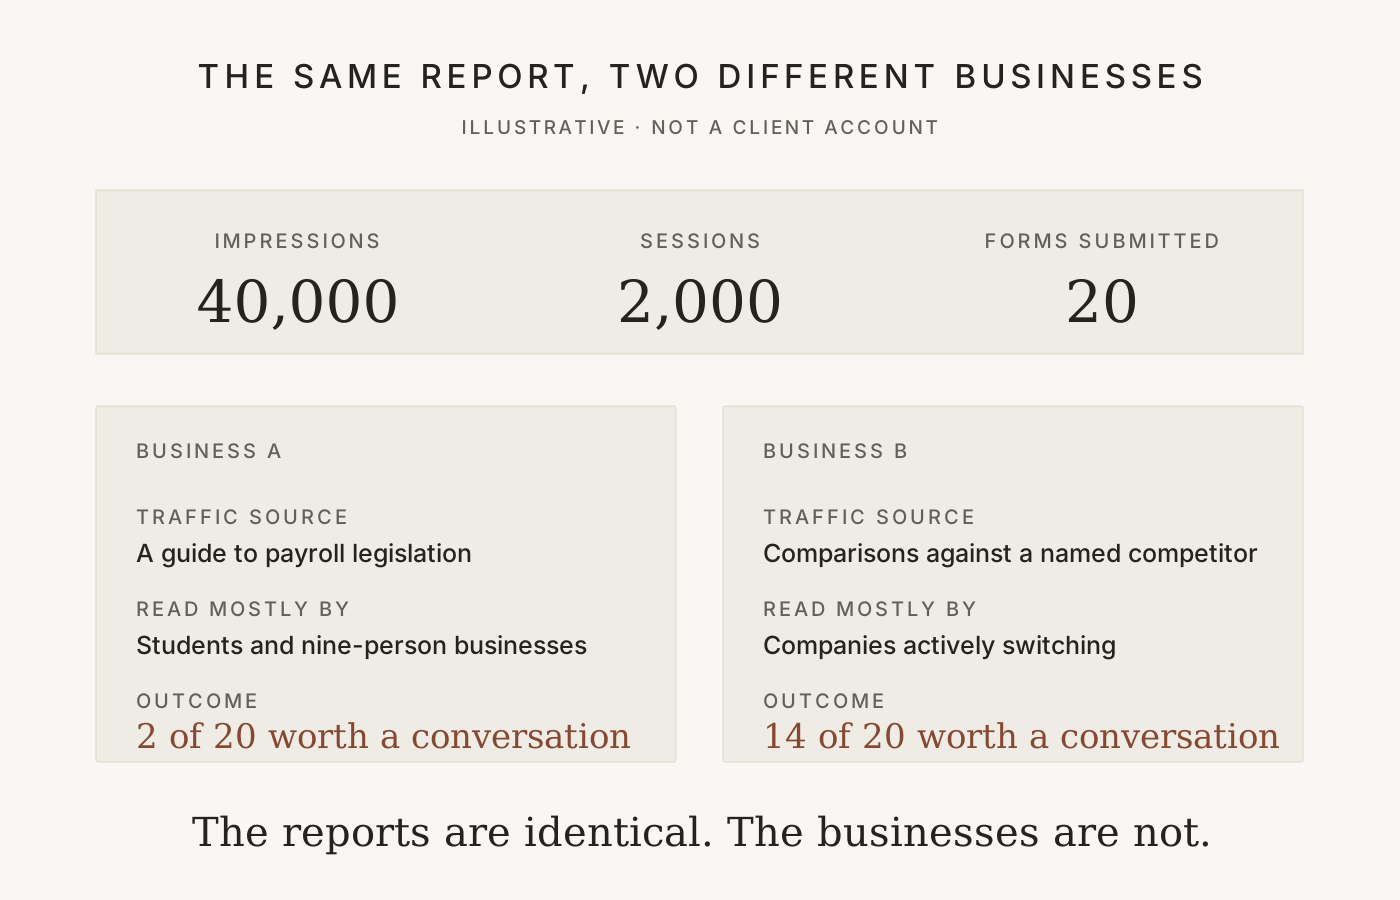
Identical impressions. Identical sessions. Identical form count. One of them should buy more traffic tomorrow. The other should stop today.
Every number in those two reports agrees. The reports are the same. The businesses are not. No amount of additional traffic would tell either of them apart, because the difference was never in the volume.
So which one is yours? That is the right question, and a dashboard cannot answer it.
What your own report is doing.
Pull the last quarter and look at which number moved.
If impressions rose, you have evidence of eligibility. If sessions rose, you have evidence of choice. If form submissions rose, you have evidence that somebody wanted to make contact, which is still not evidence that you can help them.
Most dashboards stack the three as a funnel, narrowing neatly from left to right. That picture quietly implies each stage causes the next, and that improving the first improves the last. Between impressions and sessions, the evidence above shows that implication is now unsafe. Between sessions and suitability, it was never sound.
So here is the short and slightly uncomfortable test.
Which of those three can you evidence, and which are you inferring?
Most teams can evidence the first two to the decimal place, in a tool that updates daily. The third they have been inferring for years. The third is the only one attached to revenue.
When I open a new Search Console account, that gap is the first thing I look for. Not whether the numbers are good. Whether the last one is measured at all, or assumed.
At about this point most people want to argue with me, and they have a decent case.
“But more traffic does still bring more leads.”
Often, yes. It is a fair objection and it deserves a straight answer rather than a clever one.
Hold everything about your traffic steady except the amount, and more of it will usually produce more enquiries, in roughly the same mix of good and poor. Volume is not worthless. Nobody sensible says otherwise.
Two things complicate it.
Traffic volume almost never grows while everything else stands still. It grows because you started ranking for something new, and the something new brings a different reader. The mix changes with the size. Sessions can rise by half while suitable enquiries fall, and both numbers are correct.
And if you cannot measure suitability, you cannot tell which of those two just happened to you. You will watch the sessions rise either way. The mix stays invisible, so the outcome arrives looking like luck.
The argument here was never that traffic does not matter. It is that traffic and suitability are separate measurements, and most businesses are only taking one of them.
Which leaves an obvious question. If this is true, why does nobody say it?
Why every article on this tells you the same thing.
I went and read what ranks for this question. The conclusions are close to identical.
Most traffic-but-no-leads problems are conversion problems, not traffic problems. The gap is not a volume problem, it is a conversion design problem. Twelve conversion issues to fix. Eleven reasons your pipeline stalls.
Every one of them reaches the same verdict before examining your situation. It is worth asking why they agree so completely. The people writing them sell conversion work.
Sometimes the honest answer is the opposite one. If your impressions are low for the queries your buyer actually uses, your constraint is discovery, and no amount of page optimisation will touch it. You do not need better conversion. You need more of the right visibility, and anyone telling you otherwise is describing their service rather than your situation.
That answer has to stay on the table or the whole exercise is theatre. A method that can only reach one conclusion is not a diagnosis. It is a sales process with a chart attached.
It runs the other way too, which is the point of drawing the distinction at all. More visibility, when the constraint sits downstream, buys you a bigger number that changes nothing. You will have paid to amplify a problem you already had.
What this page has not told you.
One argument, and only one. Three measures, three questions, and evidence that the first two have separated.
It has not told you which one is your constraint, and I am not going to guess at it from here. That answer is not in any public dataset. It depends on what your buyers actually search, what happens when they land, who reads the enquiry and how quickly. Those things are specific to you, and no benchmark supplies them.
So the useful next step is not a tactic. It is a question you should be able to answer before anyone sells you anything.
What evidence would tell you whether search is bringing you people your business can actually help?
If you can answer that with a number you trust, you are in a small minority, and you probably do not need help with it.
If you cannot, that is worth knowing now, rather than three months into work aimed at the wrong stage.
Most businesses find they can evidence being found. They can evidence being visited. Suitability they have been inferring from the other two for years, and calling it a funnel.
Sources and context.
SparkToro, In 2026, less than one third of Google searches still send a click, from Similarweb desktop and mobile panel data, January to April 2026. · SparkToro, Zero-click searches: highest in the UK, lowest in Germany, 17 June 2026. · Ahrefs, Zero-click search, 17 June 2025.
Bring the question to your own website.
If you would like a second opinion on which of the three your business can actually evidence, that is the conversation I am useful in.
See how the work is scoped